Introduction to Numpy
NumPy is a Python tools for scientific computing. It can be used to:
- create N-dimensional array objects.
- broadcasting of multiple arrays.
- tools for integrating C/C++ and Fortran code
- perform linear algebra, Fourier transform, and random number generation.
Installing Numpy
The best way to install Numpy is by installing the Anaconda distribution for Python as it will install some other packages also, which are commonly used in data analysis. Another way is by installing using pip install numpy command.
>>> import numpy as np #Importing the numpy module.
Making basic Numpy array
Following is the syntax for making a numpy array which is also known as ndarray (n-dimensional array):
numpy.array(object, dtype = None, copy = True, order = None, subok = False, ndmin = 0)
where:
object is the sequence to be converted into list. dtype is the datatype of the elements of array. order can be C for row major or F for column major or A for any (default). ndmin specifies the minimum dimensions of resultant array.
#Making the basic numpy array
>>> a = np.array(range(20), dtype="float", ndmin=5)
>>> print(a)
[[[[[  0.   1.   2.   3.   4.   5.   6.   7.   8.   9.  10.  11.  12.  13.
      14.  15.  16.  17.  18.  19.]]]]]
np.sctypes can be used to see the list of all available datatypes.
>>> np.sctypes
{'complex': [numpy.complex64, numpy.complex128, numpy.complex256],
 'float': [numpy.float16, numpy.float32, numpy.float64, numpy.float128],
 'int': [numpy.int8, numpy.int16, numpy.int32, numpy.int64],
 'others': [bool, object, bytes, str, numpy.void],
 'uint': [numpy.uint8, numpy.uint16, numpy.uint32, numpy.uint64]}
Numpy array attributes
Since the numpy array is ndarray object, it has many attributes which can be used to determine the properties of the array.
>>> b = np.array([[8,9,0],[5,6,7],[1,2,3],[10,11,12]], dtype='int64')
>>> b.ndim  #The dimension of the array
2
>>> b.itemsize  #size of each element in bytes
8
>>> b.dtype  # datatype of array elements
dtype('int64')
>>> b.size  #number of elements in array
12
>>> b.shape
(4, 3)
Different ways of making an array
Numpy array with all zero values:
>>> a = np.zeros((3,5),dtype=int)
array([[0, 0, 0, 0, 0],
       [0, 0, 0, 0, 0],
       [0, 0, 0, 0, 0]])
Numpy array with all one values:
>>> b = np.ones((2,4),dtype=int)
array([[1, 1, 1, 1],
       [1, 1, 1, 1]])
Numpy array in a range:
>>> c = np.arange(1,10,2)
array([1, 3, 5, 7, 9])
Numpy array with elements equally distributed over a given range:
# 9 elements equally distributed between 1 and 5
>>> d = np.linspace(1,5,9)
array([ 1. ,  1.5,  2. ,  2.5,  3. ,  3.5,  4. ,  4.5,  5. ])
Numpy array with uninitailized (random) values:
>>> e = np.empty([2,2], dtype=int)
array([[              0,        36146672],
       [139882926576392, 139882937434400]])
Operations on array
>>> a = np.array([[12,53,25,75],[4,6,8,10],[9,7,5,3],[47,92,13,71]], dtype=int)
array([[12, 53, 25, 75],
       [ 4,  6,  8, 10],
       [ 9,  7,  5,  3],
       [47, 92, 13, 71]])
Changing the dimensions of the array:
>>> a.reshape(8,2)
array([[12, 53],
       [25, 75],
       [ 4,  6],
       [ 8, 10],
       [ 9,  7],
       [ 5,  3],
       [47, 92],
       [13, 71]])
Convert array into 1D:
>>> a.ravel()
array([12, 53, 25, 75,  4,  6,  8, 10,  9,  7,  5,  3, 47, 92, 13, 71])
Array of unique elements:
>>> np.unique(a)
array([ 3,  4,  5,  6,  7,  8,  9, 10, 12, 13, 25, 47, 53, 71, 75, 92])
Minimum and maximum value of the array:
>>> print(a.min(),a.max())
3 92
Sum of all elements, takes optional argument axis 1 for row wise addition 0 for column wise addition:
>>> a.sum()
440
>>> a.sum(axis=1)
array([165,  28,  24, 223])
To find the Standard Deviation:
>>> np.std(a)
28.902854530305479
To find the square root of elements:
>>> np.sqrt(a)
array([[ 3.46410162,  7.28010989,  5.        ,  8.66025404],
       [ 2.        ,  2.44948974,  2.82842712,  3.16227766],
       [ 3.        ,  2.64575131,  2.23606798,  1.73205081],
       [ 6.8556546 ,  9.59166305,  3.60555128,  8.42614977]])
Operations on 2 numpy arrays.
>>> a = np.array([[1,2,3],[4,5,6]])
>>> b = np.array([[10,11,1],[13,14,1]])
>>> a+b
array([[11, 13,  4],
       [17, 19,  7]])
>>> a*b
array([[10, 22,  3],
       [52, 70,  6]])
>>> a/b
array([[ 0.1       ,  0.18181818,  3.        ],
       [ 0.30769231,  0.35714286,  6.        ]])
>>> a-b
array([[-9, -9,  2],
       [-9, -9,  5]])
>>> b = np.array([[10,11],[13,14],[1,2]])
>>> a.dot(b)
array([[ 39,  45],
       [111, 126]])
Indexing and Slicing of an array.
>>> a = np.array([[12,53],[8,10]], dtype=int)
>>> b = np.arange(4).reshape(2,2)
>>> a[:,:]
array([[12, 53],
       [ 8, 10]])
>>> a[0:2,0:1]
array([[12],
       [ 8]])
#vertically stack 2 arrays
>>> np.vstack((a,b))
array([[12, 53],
       [ 8, 10],
       [ 0,  1],
       [ 2,  3]])
#horizontally stack 2 arrays
>>> np.hstack((a,b))
array([[12, 53,  0,  1],
       [ 8, 10,  2,  3]])
#vertically split array into equal parts
>>> np.vsplit(a,1)
[array([[12, 53],
        [ 8, 10]])]
#horzonatally split array into equal parts
>>> np.hsplit(a,1)
[array([[12, 53],
        [ 8, 10]])]
#concat 2 arrays
>>> np.concatenate((a,b))
array([[12, 53],
       [ 8, 10],
       [ 0,  1],
       [ 2,  3]])
Data Filtering
>>> a = np.array([[12,53,25,75],[4,6,8,10],[9,7,5,3],[47,92,13,71]], dtype=int)
#find all elements in a with value greater than equal to 10
>>> b = a>=10
array([[ True,  True,  True,  True],
       [False, False, False,  True],
       [False, False, False, False],
       [ True,  True,  True,  True]], dtype=bool)
#elements in b having True value will be assigned value -1 in a (elements in a with value greater than equal to 10)
>>> a[b] = -1
>>> a
array([[-1, -1, -1, -1],
       [ 4,  6,  8, -1],
       [ 9,  7,  5,  3],
       [-1, -1, -1, -1]])
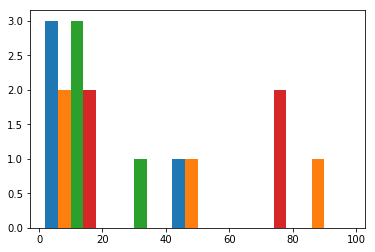
Plotting the frquency bar graph of numpy array data.
#using the matplotlib module for plotting
from matplotlib import pyplot as plt
a = np.array([[12,53,25,75],[4,6,8,10],[9,7,5,3],[47,92,13,71]], dtype=int)
#using the histogram function
plt.hist(a, bins = [0,20,40,60,80,100])
plt.show()